Here is a neat technique you can use to gather data right from inside your Tableau dashboard and write it to a 'database', which you can then connect to live to see real-time results.
Tableau is a read-only tool. This is on purpose. However sometimes there are scenarios where you might want to capture commentary, or host a poll/survey from inside Tableau, and you want to write that data back somewhere else. Enter Google Forms and Google Sheets. This technique works because Google Forms can accept entries via URL. And Tableau and send URL actions which include dynamic inputs from your data. Therefore we can post data to a Google Form from any Tableau dashboard to achieve 'write back' functionality. I will walk through two use cases, but Im sure you will find many other creative ways of using this.
First step is to create your
Google Form. Create
questions that are the same data type as what you want to have your users enter
in tableau (numbers, string/text, etc).
For long
Text input choose Paragraph:

And for
numerical input you still choose text type of input, but choose Short Answer:

Note the
unique ID of your form. You will need
this later when we make the URL Action in Tableau.

Right click
in background and choose ‘View Page Source’:

Search for
‘entry’ and you will see them listed in order.
First occurrence is Question 1, next is Question 2, etc. We will need to reference these when we create our URL action in Tableau.

Now let's set up a couple things in Tableau before we get to the URL actions (will need to make parameters and will need a sheet to act as the 'send' or 'submit' button).
Create a
Parameter(s) in Tableau of the data type you want (string, integer, float, etc). Show the Parameter(s) on your dashboard
somewhere. In this example I have a set
of numerical parameters used for voting and another parameter used to capture
comments (lets focus on the comment for now).

Create a new
worksheet which uses the ‘Shape’ mark type and add a custom shape for your
‘Submit’ button.

Add this
worksheet to your dashboard.
We will now create a URL
Action to post the data to the Google Form. Construct your URL so that it contains the Unique ID for your Google
Form we found earlier in the browser, as well as all the
entries/responses/inputs/parameters in it as well (separating them with
‘&’). The form of the URL should
look like this:
https://docs.google.com/forms/d/[UNIQUE_ID_OF_YOUR_GOOGLE_FORM]/formResponse?ifq&entry.[ENTRY_1_ID]=[INSERT_PARAMETER_YOU_WANT_TO_ENTER_FROM_TABLEAU]&submit=Submit
https://docs.google.com/forms/d/1irBqi5wLkhEnMGqM87o5dbSF7_m1Ia9Uj6QCKo2J86U/formResponse?ifq&entry.1379436949=&submit=Submit
If you need
to submit multiple parameters/entries from this submission/click then separate
them with ‘&’s and enter as many as you want:
…./formResponse?ifq&entry.[ENTRY_1_ID]=[PARAMETER_1]&entry.[ENTRY_2_ID]=[PARAMETER_2]&entry.[ENTRY_3_ID]=[PARAMETER_3]&submit=Submit

Add the
Parameter values using the arrow on the side:


Then after
you submit your first response you can return to the Google Form in the browser
and you will see your first ‘comment’.
Click the Spreadsheet icon to create (and then see) the Google Sheet:


And now
let's look at what the Numerical inputs for out beer voting parameters look
like in the Google Sheet of Responses:

Awesome! Now we can open a new Tableau workbook to connect to this Google Sheet and build whatever dashboards we want from it. If you are using Tableau 10 just select ‘Google Sheets’ in the Connect To Data list:

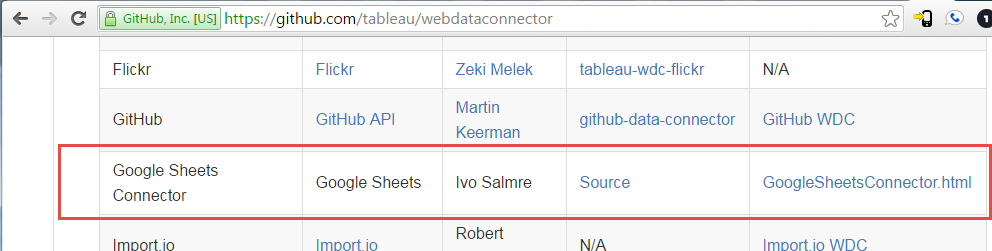
In 9.3 and earlier you will need to use the Web Data Connector to connect to Google Sheets. Go here and scroll down until you get to the Google Sheets Connector:
Now you
have a live connection set up to the sheet of responses – create whatever you
want with it! Here is a simple example using
the voting/poll results:

Credit to Dash Davidson who showed me this technique in his presentation at Tableau Conference 2015!
-The Don


